
Experimentation Techniques - A/B Testing

Take the guesswork out of major projects and marketing campaigns with A/B testing. Shift the conversations in your organisation from “we think” to “we know”.
Introduction
A/B testing is the process of testing a control version of an experiment (Experiment A), against a near identical version of the same experiment (Experiment B), except where one element of the experiment has changed to impact customer behaviour.
A/B testing is the simplest form of experimentation. A/B tests are commonly conducted on websites, landing pages, digital ads and email marketing.
We never can truly know what will work. This results in many assumptions being made around what we perceive customers value.
It can be tempting to use intuition to predict what will make customers click or purchase. This type of decision-making can be really detrimental to business performance.
Remove the guesswork from decisions with A/B testing so that you can deliver more projects and campaigns successfully.
Run controlled experiments to decipher what your customers value prior to executing a mass-market launch. A/B testing facilitates high quality business decisions by proving or disproving your hypotheses with quantitative facts and data.
What is a A/B testing?
History of A/B testing
While A/B testing is now most readily associated with the digital environment (website and apps), the method is nearly 100 years old.
In the 1920’s statistician and biologist Ronald Fisher discovered the principles behind A/B testing and randomised controlled experiments. Fisher was the first to figure out the basic principles and mathematics of A/B testing and make them a science.
He ran agricultural experiments, asking questions such as, “What happens if I put more fertiliser on this land?”. The principles gathered momentum and in the early 1950’s scientists started running clinical trials in medicine. In the 1960’s and 1970’s the concept was adapted by marketers to evaluate direct response campaigns (E.g. Would a postcard or a letter to target customers result in more sales?).
A/B testing, in its current form, came into existence in the 1990’s. The math behind running A/B tests hasn’t changed over the years, however, tests can now be executed in real-time with digital tools.
Overview of A/B testing
A/B testing is the simplest, most basic form of randomised, controlled experimentation.
This method of testing has grown in popularity with the online environment as it enables business leaders to quickly and easily answer questions. For example, “What is most likely to make people click?”, or “Buy our product?”, or “Register on our website?”.
A/B testing is now used to evaluate everything from website design, new offers, headlines, ads, emails or product descriptions.
Experiments now run seamlessly. Unknowingly, we’re all regularly participants in experiments.
A/B testing is the process of testing one version of a new product or feature (Experiment A), against a near identical version (Experiment B).
“The world is one big A/B test” - Sean Ellis
The difference between the two experiments is that for Experiment B, one element of the experiment has changed to understand the impacts on customer behaviour.
The A and B versions of the experiment are shown to customers, with data analysis being used to determine which version of the experiment performed the best against a pre-defined business goal or metric.
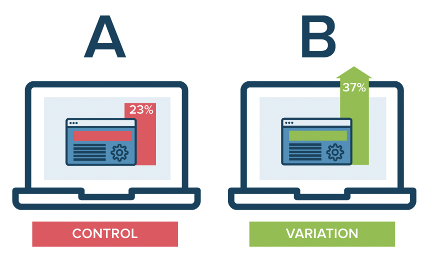
Credit: Optimizely
Sometimes there may be situations where it makes sense to test multiple variables, rather than one variable at a time. This process is called Multivariate Testing. In this scenario, you’re running an A/B/C/D experiment.
Customer sampling
A/B tests are executed for a set period of time, to a defined audience.
The experiments may be distributed to a randomised sample of customers – for example, traffic to your website homepage is split, with visitors being served either the control (Experiment A) or the variation (Experiment B).
Alternatively, experiments may also be distributed to a highly targeted and specific cohort of customers or users. For example, if your product is a marketplace, you may run an experiment to test an idea for a highly targeted and specific cohort of high-value sellers on the platform. The experiment would not be served to buyer customers.
Customer targeting is dependent on the proposition, product or feature to be tested and the intended target audience.
Improving decision-making
A/B testing facilitates data-driven learning and decision-making.
It’s all about the data these days. Business leaders shouldn’t be making decisions without facts and evidence.
There are lots of experimentation methods and techniques to gather data without relying on instincts.
Shift the conversation in your organisation from “we think” to “we know”
Running a new variation against an existing experience allows teams to gather data to assess the impact of a proposed change – is the proposed changed positive, neutral or negative?
A/B testing takes the guesswork out of delivering new products, features or experiences.
Why it’s important to run A/B tests
A/B tests enable product development and project teams to test new ideas to understand how changes to user experience will impact business performance.
A/B testing collects data from experiments so that teams can understand what works and what doesn’t work, in advance of conducting a mass-market implementation.
Decisions on the merit of an idea are fact-based, rather than false facts such as opinion or assumption. A/B testing is a great way to test your theories and hypothesis. Be prepared to be proven wrong.
“Most A/B tests fail. That’s OK, as long as you are testing based on a hypothesis that teaches you something if it fails”
A/B testing allows you to optimise for the change that you’re trying to make. You can figure out through an iterative testing process what will drive the highest click through rate or conversion rate, before making a change.
Discover what offer framing drives the highest click through rates
Discover which representation of a landing page drives the highest conversion rates
Discover which subject line of your EDM generates the highest open rates
Cumulatively, over time, A/B testing is compounding. Every idea you discover that has a positive impact, gets you incrementally closer to achieving your key metrics and business goals.
Spend less on marketing activity to achieve more successful business outcomes.
“It is more than a one-off event – A/B testing should be a habitual routine”.
How to conduct an A/B test
Steps for running successful A/B tests:
Do your research
Develop your hypothesis
Select your variable to test
Define your key success criteria
Customer targeting
Design your experiments
Set sample sizes
Define statistical significance
Execute your experiments
Analyse your results
Turn data into actions
Keep experimenting
STEP 1 - Do your research
Gather existing data, information, facts and research to help you understand the problem space in more detail.
What is the problem that you’re trying to solve?
What is the business opportunity that you’ve identified?
STEP 2 - Develop your hypothesis
Once you’ve identified an opportunity for investigation, think about your hypothesis.
What is your theory on the expected outcome of your experiments?
Ensure that your hypothesis is specific, testable and falsifiable – you must be able to prove your hypothesis wrong.
STEP 3 - Select your variable to test
You’ve no doubt got lots of different ideas that you want to test. Prioritise those ideas that are potentially going to drive the biggest impact on customer experience and business performance.
Select the one independent variable that you’re going to isolate and test.
You can test more than one variable on a landing page or email, just make sure it’s one at a time. Remember, if you’re trying to test multiple variables at the one time it is difficult to understand cause and effect.
Some times it may make sense to test multiple variables at once to understand how the different variables interact. This form of testing is called Multivariate Testing.
Optimizely wrote a good article on the differences between A/B Testing and Multivariate Testing
Be mindful that small changes can produce big improvements.
STEP 4 - Define key success criteria
This is critical. Set meaningful and relevant success criteria.
What is the primary metric that you want to focus on? This is your dependent variable.
This helps you to compare the relative performance of Experiment A to that of Experiment B. Experiments should not be executed without success metrics – otherwise every experiment is a winner.
Setting success criteria upfront enables the experiment to be established in the most effective manner.
Think about the key action that you want to elicit from the user.
Is it purchasing a product, clicking a button or completing a form? What is the change that you expect to see running the experiment?
STEP 5 - Customer targeting
Which customers are you going to target for your experiment?
Are you going to serve your experiments to a randomised sample of customers, or are you going to serve the experiments to a specific, targeted cohort of customers?
STEP 6 - Design your experiments
Create variations of your experiment so that you have a Control Experiment (A), and a Challenger Experiment (B).
This may involve changing a headline, using a different call to action, reframing the product value proposition etc.
For example, if you’re seeking to understand whether social proof will increase conversion rates on your product page, establish a Control Experiment with no product reviews, and a Challenger Experiment (B) with customer product reviews.
STEP 7 - Set sample sizes
Data sample sizes must be large enough (and equal) to be able to provide reliable and conclusive results.
Testing sample sizes should be large enough to yield statistically relevant results and reducing sampling errors.
Sample size will also be dependent on the type of experiment you’re running. If you’re running an email A/B test, you don’t want to send the experiment to your entire customer database, only a sub set of target customers to achieve statistically significant results.
The duration of your experiment may also be a consideration to produce a large enough sample.
If you’re running an experiment on your website, that doesn’t have a binary sample size like email, you’ll need to run the experiment for long enough to yield a representative sample size so that results are statistically significant.
STEP 8 - Statistical significance
Statistical significance depends on the level of confidence you require, and the risk you’re willing to take.
The higher your expected confidence level, the more sure you need to be about your results.
For mature products, services and experiences you’re going to be seeking a confidence level of 95%+. However, for preliminary, early-stage concept testing the risk appetite will be much higher at this stage of the product development process, given you’re pre-revenue and there’s still so many unknowns.
Statistical significance is a bit like placing a bet at the casino. Are you happy placing a bet (business investment) with a 75% confidence level, or do you require a higher level of confidence?
Matt Rheault from HubSpot states:
“the takeaway here is that the more radical the change, the less scientific we need to be process-wise. The more specific the change (button colour, micro copy, etc.), the more scientific we should be because the change is less likely to have a large and noticeable impact on conversion rate."
Rheault goes further to suggest, “you’ll likely want a higher confidence threshold when testing for something that only slightly improves conversation rate. Why? Because random variance is more likely to play a bigger role. An example where we could feel safer lowering our confidence threshold is an experiment that will likely improve conversion rate by 10% or more.
STEP 9 - Execute your experiments
Kick off your experiments.
Make sure that you test the A and B experiments at the same time. Running the experiments at different times (days, months) may likely introduce variability in your results.
This is important as you don’t want to have people second-guessing your results.
Be careful when running multiple A/B tests at the same time. If you’re running multiple experiments simultaneously that are using the same digital asset (landing page), you’re not going to be able to understand what is impacting conversion rates.
STEP 10 - Analyse your results
Once your experiment has been completed, it’s now time to analyse your results.
Analyse the data and results from your experiments to understand how the two versions of your experiment performed.
What conclusions can you draw from the data?
Did your variant (Experiment B) produce a positive, neutral or negative result compared to the control experiment (Experiment A).
Was there a meaningful, statistically significant difference?
Oftentimes, it’s not clear “why” customers are producing certain behaviours in A/B tests.
Use qualitative research (customer interviews) to understand why customers are behaving in a certain manner.
STEP 11 - Turn data into actions
You now need to decide your next actions.
If there was a clear winner, with one version being statistically superior to the other, you know which version to implement.
If neither version was statistically better, you’ve learned that the variant that you tested didn’t impact business performance, so stick with the original experience.
In this case, what’s your next version or iteration of your failed experiment? What’s your new hypothesis.
Whatever the outcomes of your experiment, use the experience to bank organisational learnings.
“The results and learnings from previous experiments inform future experiments”
STEP 12 - Keep experimenting
Wait, it’s not the end of the journey, it’s just the beginning. There’s always more opportunities to learn through experimentation.
If you’ve just tested and optimised the subject line of your email, you’re not done yet.
Think about what other elements of your email you could test through experimentation - offer framing, imagery, body copy, features articulation, benefits articulation, CTA’s etc.
Keep experimenting and iterating to improve customer experience and business performance.
Example - Amazon tests list vs grid product layout
Late last year Amazon ran an A/B test to understand which product page listing layout (Classic List or Grid Layout) drove the highest conversion rates.
Amazon ran this experiment on some random queries such as “tools for mechanics” and “sports gear”.
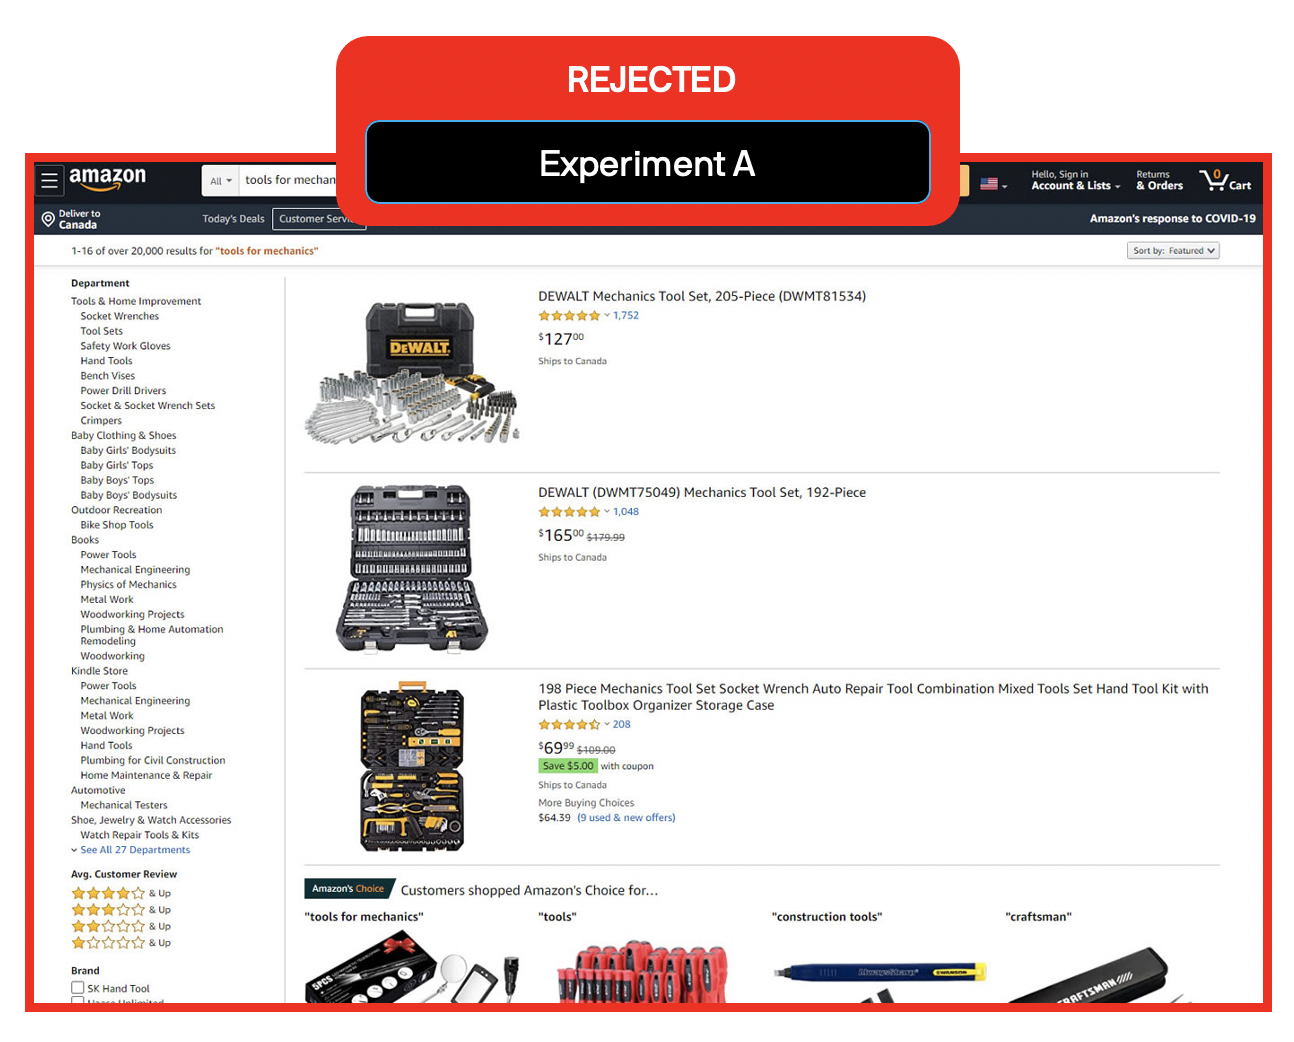
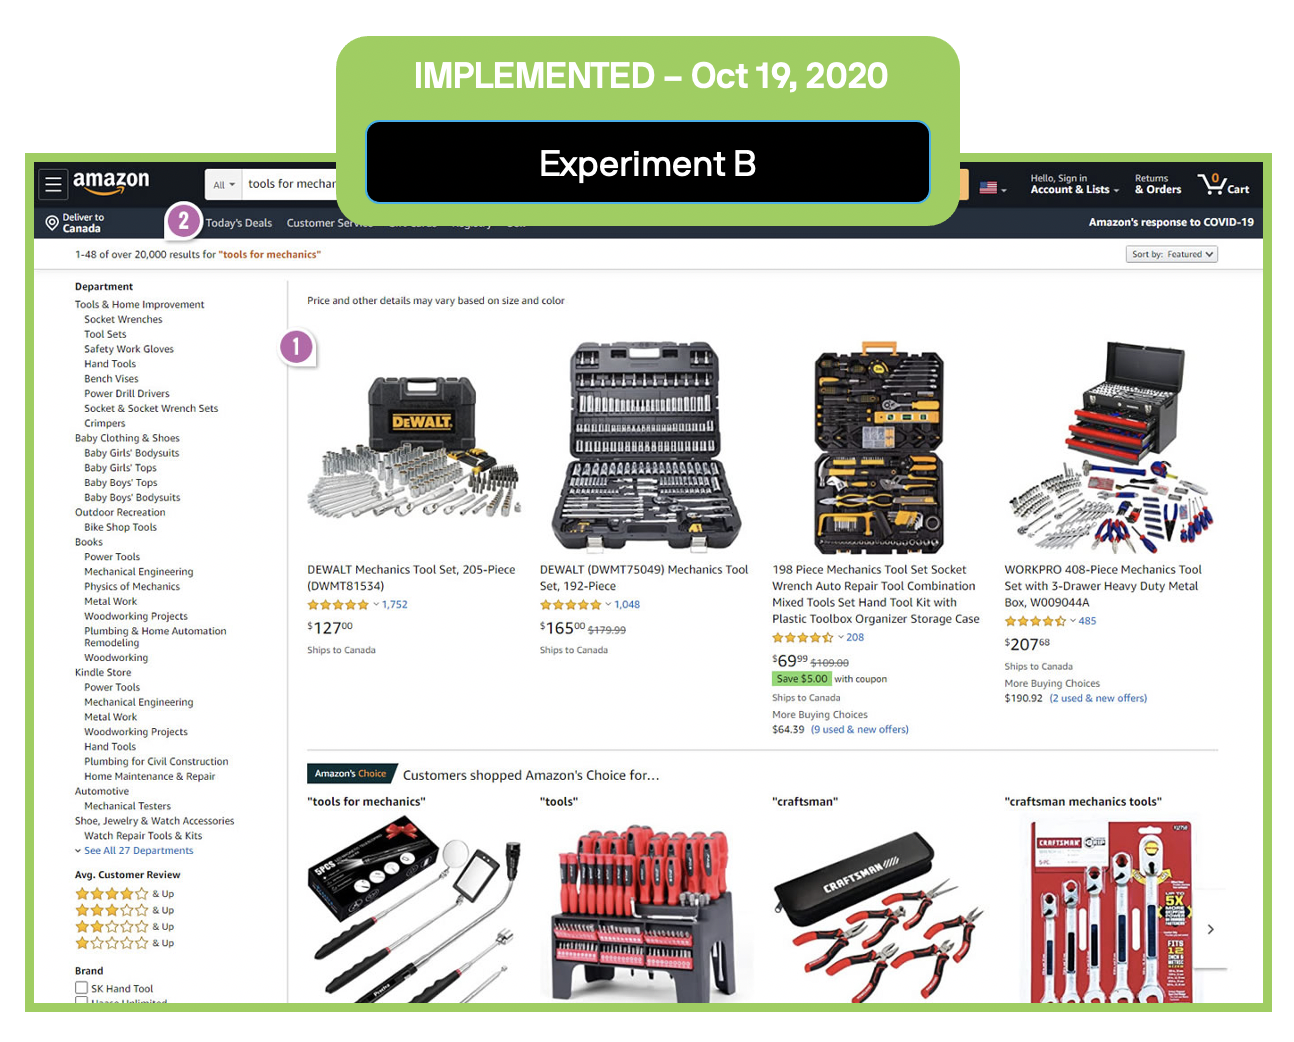
1.List vs Grid Layout
The variation (Experiment B) displayed all the same product tile information in a Grid instead of a List view.
2.Results display
The number of products displayed for the search result for Experiment B was increased from 16 to 48.
3.Experiment result
Amazon decided to change the product page listing display from a List display, to the Grid display.
Some observations about this experiment …
For this A/B test it’s interesting that Amazon changed two variables for Experiment B.
The product listing display
The number of products displayed for the search result
I assume that the key variable that is being isolated in this experiment is the product listing display.
Did the product listing display cause an increase in conversion rates?
Did serving more products to the customer in the search results cause an increase in conversion rates?
Or, was it a combination of both variables? Don’t know. Maybe Amazon was seeking to test the interaction of both the product listing display, coupled with increasing the number of product search results?
Amazon have got a whole bunch of super smart people working for them. I’m sure that there was a data-driven reason to implement this change :)
10 ways you can use A/B testing
There are many different variables that you can potentially test with A/B testing.
Below is a list of common variables to get you started. Depending on your business type and industry, there’s likely many other variables to test too.
1. Marketing campaigns
Test the headlines and subject lines of your marketing campaigns to understand which copy drives the highest amount of interest from your customers.
The headline is usually the first thing that customers notice – figure out how you can be more influential and persuasive to generate more successful campaigns.
2. CTA
Your CTA drives prospects or your customers to perform an action. What is it that you’re trying to get customers to do?
A/B testing can reveal which CTA’s have the highest level of impact for your business. Is it “Buy Now” to purchase your product, or “Learn More” to further engage prospects?
3. Sales copy
Spend the time optimising copy for your marketing and sales collateral. This can have a significant impact on conversion rates. Figure out the best way to articulate offer framing, features and benefits to your customers.
4. User onboarding
This is worthy of a whole post in itself and the reason that organisations have teams dedicated to the customer onboarding journey.
How can you get users to experience your product magic moment as fast as possible with the least amount of friction?
Can you increase the number of people trialling your product and, experiencing the value in your product, driving higher retention rates?
5. Pricing
Pricing is one of the most important parts of any business model.
Price too low and you leave value on the table, price too high and you throttle customer demand.
Every business has many assumptions around pricing. A/B test your pricing to optimise for revenue and customer acquisition.
6. Channels
Run experiments to figure out which channel/s are most likely to be your engines of growth.
Based on your business type, will paid advertising, virality or SEO and content be your primary driver of growth
7. Signup forms
Different sign-up forms can have very different sign-up rates.
Improve sign up rates by testing the composition of your sign-up forms – CTA, copy, placement etc.
8. Page layouts
Web page layout and design undoubtedly influence user behaviours.
Test multiple variations of your core web pages to understand which design and user experience drives the biggest business impact.
9. Social proof
Social proof indicators can have an influence on whether customers trust your business and are willingly to become a customer.
Run A/B tests to learn more about which trust indicators work best for your business – ratings, customer reviews, recommendations, testimonials etc.
10. Media:
Experiment with different forms of media to understand which drives the highest engagement rates with your audience – video, audio, images, text.
Common mistakes with A/B testing
Some common mistakes that companies make when running A/B tests:
1. Impatience
It’s easy to get overexcited when running A/B tests and make decisions prematurely. Results for experiments are available in real-time so it can be tempting to “results watch” and make a call to terminate experiments quickly if the results are initially trending positive.
After launching an experiment, it can take a few days for the data to settle into a natural baseline.
If you don’t let the experiment run its course, you could very well end up with False Positive or False Negative results.
2. Not focussing on the primary metric
There’s a lot of different data points and information that are generated through running experiments. It can be easy to get caught up in the data trying to determine correlation and causation.
What matters most is your key success metric (clicks, signups, conversions etc.) that you defined before executing the experiments. Relative to your Control (Experiment A), did the variant (Experiment B) produce an increase, decrease or neutral result?
A good mantra is to always ask yourself, “What’s happening with the primary metric?”.
Secondary and tertiary data points can be helpful in adding context to your primary success metric, but stay focussed on your primary metric for your analysis.
3. Incorrect assumptions
“Any figure that looks interesting or different is usually wrong” - W A Twyman
The above statement is referred to as Twyman’s Law. If your results look too good to be true, then they usually are. It can be easy to fall in to the trap of running an experiment once, and believing every result.
Retesting is a natural part of running any experimentation program at scale. The more experiments that you run, the more chance of producing outlier results.
In order for your testing results to be valuable, they need to be reliable.
Conclusion
Learn the truth about what your customers want with A/B testing.
You never know what is going to work until you test it.
A/B testing takes the guesswork out of a new product, feature or campaign by enabling you test performance of your idea before scaled launch. This promotes data-driven, fact-based decision-making.
This approach to project delivery allows you to continually optimise the core elements of your proposition to figure out which combination of design and user experience drives the biggest business impact.
A/B testing increases the success of your campaigns or offers, while facilitating more effective business investments.
If you’re not making decisions based on data and insight from experiments, you’re setting yourself up for failure.
Human beings are inherently bad at predicting the future. We just can’t possibly know what will be right.
Be more successful in your role with experimentation.
References:
Optimizely, Wikipedia, Hubspot, Harvard Business Review, Crazy Egg
Before you finish...
Did you find this article helpful? Before you go, it would be great if you could help us by completing the actions below.
By joining the First Principles community, you’ll never miss an article.
Help make our longform articles stronger. It only takes a minute to complete the NPS survey for this article. Your feedback helps me make each article better.
Or share this article by simply copy and pasting the URL from your browser.